|
A continuación se informa sobre el consumo per cápita de alimentos y bebidas en la República Argentina. Se
anexan además, informes sobre sus caracteristicas mas importantes en los sectores relevantes.
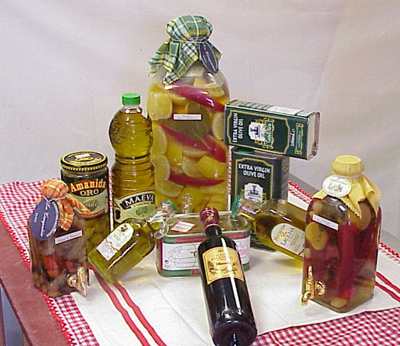
Aceites - Consumo per Cápita
| Sector |
Producto |
|
2006 |
| Aceites |
Aceite de soja |
kg/ha |
12,81 |
| Aceite de girasol |
kg/ha |
9,59 |
| Aceite de maíz |
kg/ha |
0,57 |
| Aceite de maní |
kg/ha |
0,00 |
| Aceite de canola |
kg/ha |
0,02 |
| Total |
kg/ha |
22,99 |
|
|
|
|
| kg/ha (kilogramos por habitante
año) |
|
Ver informe aceites
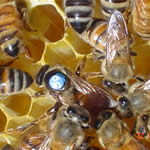
Apícola - Consumo per Cápita
| Sector |
Producto |
|
2006 |
| Apícola |
Miel |
kg/ha |
0,42 |
| Propóleo |
kg/ha |
s/d |
| Total |
kg/ha |
0,42 |
|
|
|
|
| kg/ha (kilogramos por habitante año) |
|
Ver informe apícola
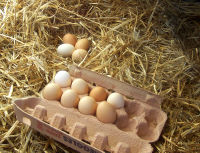
Ovoproductos - Consumo per Cápita
| Sector |
Producto |
|
2006 |
| Ovoproductos |
Consumo
Industrial |
h/ha |
16 |
| Huevos Frescos |
h/ha |
164 |
| Total |
h/ha |
180 |
|
|
|
|
| h/ha (huevos por habitante año) |
|
|
Ver informe ovoproductos
Azúcar - Consumo per Cápita
| Sector |
Producto |
|
2003 |
| Azúcar |
Endulcorante |
kg/hab |
14,9 |
| Insumo Industrial |
kg/hab |
22,3 |
| Total |
kg/hab |
37,2 |
|
|
|
|
| kg/hab (kilogramos por
habitante año) |
|
|
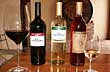
Bebidas - Consumo per Cápita
| Sector |
Producto |
|
Est. |
| Bebidas |
Agua Mineral |
l/hab |
20,0 |
| Cerveza |
l/hab |
35,0 |
| Gaseosas |
l/hab |
75,0 |
| Jugos |
l/hab |
38,0 |
| Soda |
l/hab |
80,0 |
| Vino |
l/hab |
29,0 |
| Vino Espumante |
l/hab |
0,6 |
| Total |
l/hab |
277,60 |
|
|
|
|
| l/hab (litros por habitante
año) |
|
|
| Est. (Estimado) |
|
|
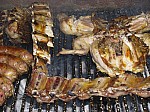
Carnes - Consumo per Cápita
| Sector |
Producto |
|
2006 |
| Carnes |
Vacuna |
kg/hab |
63,40 |
| Aviar |
kg/hab |
27,80 |
| Porcina |
kg/hab |
7,34 |
| Pescado |
kg/hab |
10,27 |
| Total |
kg/ha |
108,81 |
|
|
|
|
| kg/hab (kilogramos por
habitante año) |
|
|
Ver informe carnes
Cereales - Consumo per Cápita
| Sector |
Producto |
|
Est. |
| Cereales |
Arroz |
kg/hab |
6,0 |
| Maíz |
kg/hab |
s/d |
| Soja |
kg/hab |
s/d |
| Total |
kg/hab |
6,0 |
|
|
|
|
| kg/hab (kilogramos por
habitante año) |
|
|
| Est. (Estimado) |
|
|
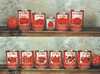
Conservas - Consumo per Cápita
| Sector |
Producto |
|
2006 |
| Conservas |
Durazno |
kg/hab |
1,03 |
| Tomate |
kg/hab |
7,21 |
| Total |
kg/hab |
8,24 |
|
|
|
|
| kg/hab (kilogramos por
habitante año) |
|
|
Farináceos - Consumo per Cápita
| Sector |
Producto |
|
Est. |
| Farináceas |
Galletitas y Bizcochos |
kg/hab |
7,4 |
| Pan Artesanal |
kg/hab |
70,0 |
| Pan Industrial |
kg/hab |
3,8 |
| Pastas Frescas |
kg/hab |
2,5 |
| Pastas Secas |
kg/hab |
7,0 |
| Total |
kg/hab |
90,7 |
|
|
|
|
| kg/hab (kilogramos por
habitante año) |
|
|
| Est. (Estimado salvo Galletitas
y Bizcochos año 2006) |
Frutas Frescas
Pomáceas - Consumo per Cápita
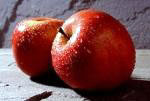
| Sector |
Producto |
|
2006 |
| Pomáceas |
Manzana |
kg/hab |
7,50 |
| Pera |
kg/hab |
3,50 |
| Total |
kg/hab |
11,00 |
|
|
|
|
| kg/hab (kilogramos por
habitante año) |
|
|
Cítricos - Consumo per Cápita
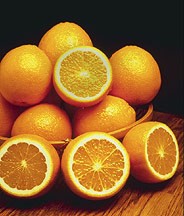
| Sector |
Producto |
|
2006 |
| Cítricos |
Limón |
kg/hab |
3,80 |
| Naranja |
kg/hab |
15,00 |
| Mandarina |
kg/hab |
7,00 |
| Pomelo |
kg/hab |
2,90 |
| Total |
kg/ha |
28,70 |
|
|
|
|
| kg/hab (kilogramos por
habitante año) |
|
|
Harinas - Consumo per Cápita
| Sector |
Producto |
|
2006 |
| Harinas |
Trigo |
kg/hab |
83,70 |
| Glúten |
kg/hab |
0,13 |
| Total |
kg/hab |
83,83 |
|
|
|
|
| kg/hab (kilogramos por
habitante año) |
|
|
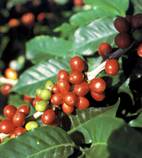
Infusiones - Consumo per Cápita
| Sector |
Producto |
|
2006 |
| Infusiones |
Café |
kg/hab |
0,75 |
| Té |
kg/hab |
0,14 |
| Yerba Mate |
kg/hab |
6,01 |
| Total |
kg/ha |
6,90 |
|
|
|
|
| kg/hab (kilogramos por
habitante año) |
|
|
Lácteos
Leche Fluída - Consumo per Cápita
| Sector |
Producto |
|
2006 |
| Leches Fluídas |
Leche pasteurizada |
lts/hab |
31,31 |
| Leche esterilizada |
lts/hab |
10,63 |
| Leche chocolatada |
lts/hab |
1,02 |
| Total |
lts/hab |
42,96 |
|
|
|
|
| lt/hab (litros por habitante
año) |
|
|
Ver informe leches fluídas
Leche en Polvo - Consumo per Cápita
| Sector |
Producto |
|
2006 |
| Leche en Polvo |
En polvo entera |
kg/hab |
1,28 |
| En polvo descremada |
kg/hab |
0,20 |
| Total |
kg/hab |
1,48 |
|
|
|
|
| kg/hab (kilogramos por
habitante año) |
|
|
| 1 kg de leche en polvo
rinde 8 litros de leche |
|
Ver informe leche en polvo
Quesos - Consumo per Cápita
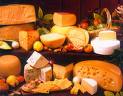
| Sector |
Producto |
|
2006 |
| Quesos |
Queso pasta dura |
kg/hab |
1,13 |
| Queso pasta semidura |
kg/hab |
3,08 |
| Queso pasta blanda |
kg/hab |
5,88 |
| Queso fundido |
kg/hab |
0,28 |
| Total |
kg/hab |
10,37 |
|
|
|
|
| kg/hab (kilogramos por
habitante año) |
|
|
Ver informe quesos
Otros Productos Lácteos - Consumo per Cápita

| Sector |
Producto |
|
2006 |
| Otros Productos Lácteos |
Crema |
kg/hab |
0,97 |
| Manteca y aceite
butírico |
kg/hab |
0,74 |
| Dulce de leche |
kg/hab |
2,84 |
| Leche condensada |
kg/hab |
0,19 |
| Yogur |
kg/hab |
11,99 |
| Postres, flanes
y helados |
kg/hab |
0,78 |
| Total |
kg/hab |
17,51 |
|
|
|
|
| kg/hab (kilogramos por
habitante año) |
|
|
Verduras
Hortalizas - Consumo per Cápita
| Sector |
Producto |
|
Est. |
| Hortalizas |
Ajo |
kg/hab |
0,6 |
| Batata |
kg/hab |
3,5 |
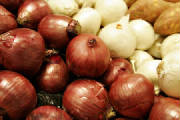
| Cebolla |
kg/hab |
10,0 |
| Espárrago |
kg/hab |
0,3 |
| Lechuga Capuchina |
kg/hab |
1,7 |
| Lechuga Criolla |
kg/hab |
18,7 |
| Mandioca (Fresca) |
kg/hab |
4,5 |
| Papa |
kg/hab |
57,0 |
| Tomate |
kg/hab |
26,0 |
| Zanahoria |
kg/hab |
6,0 |
| Total |
kg/hab |
128,3 |
|
|
|
|
| kg/hab (kilogramos por
habitante año) |
|
|
| Est. (Estimado) |
|
|
Legumbres - Consumo per Cápita
| Sector |
Producto |
|
Est. |
| Legumbres |
Arvejas |
gr/hab |
100 |
| Garbanzos |
gr/hab |
40 |
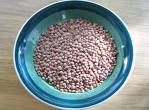
| Lentejas |
gr/hab |
140 |
| Porotos |
gr/hab |
120 |
| Total |
gr/hab |
400 |
|
|
|
|
| gr/hab (gramos por habitante
año) |
|
|
| Est. (Estimado por Producción
Tucumán) |
|
|
|
